How Americagot hurtin 2025.
An estimated 16.5 million emergency-room visits for injuries involving everyday products. Most of them began with a fall.
↓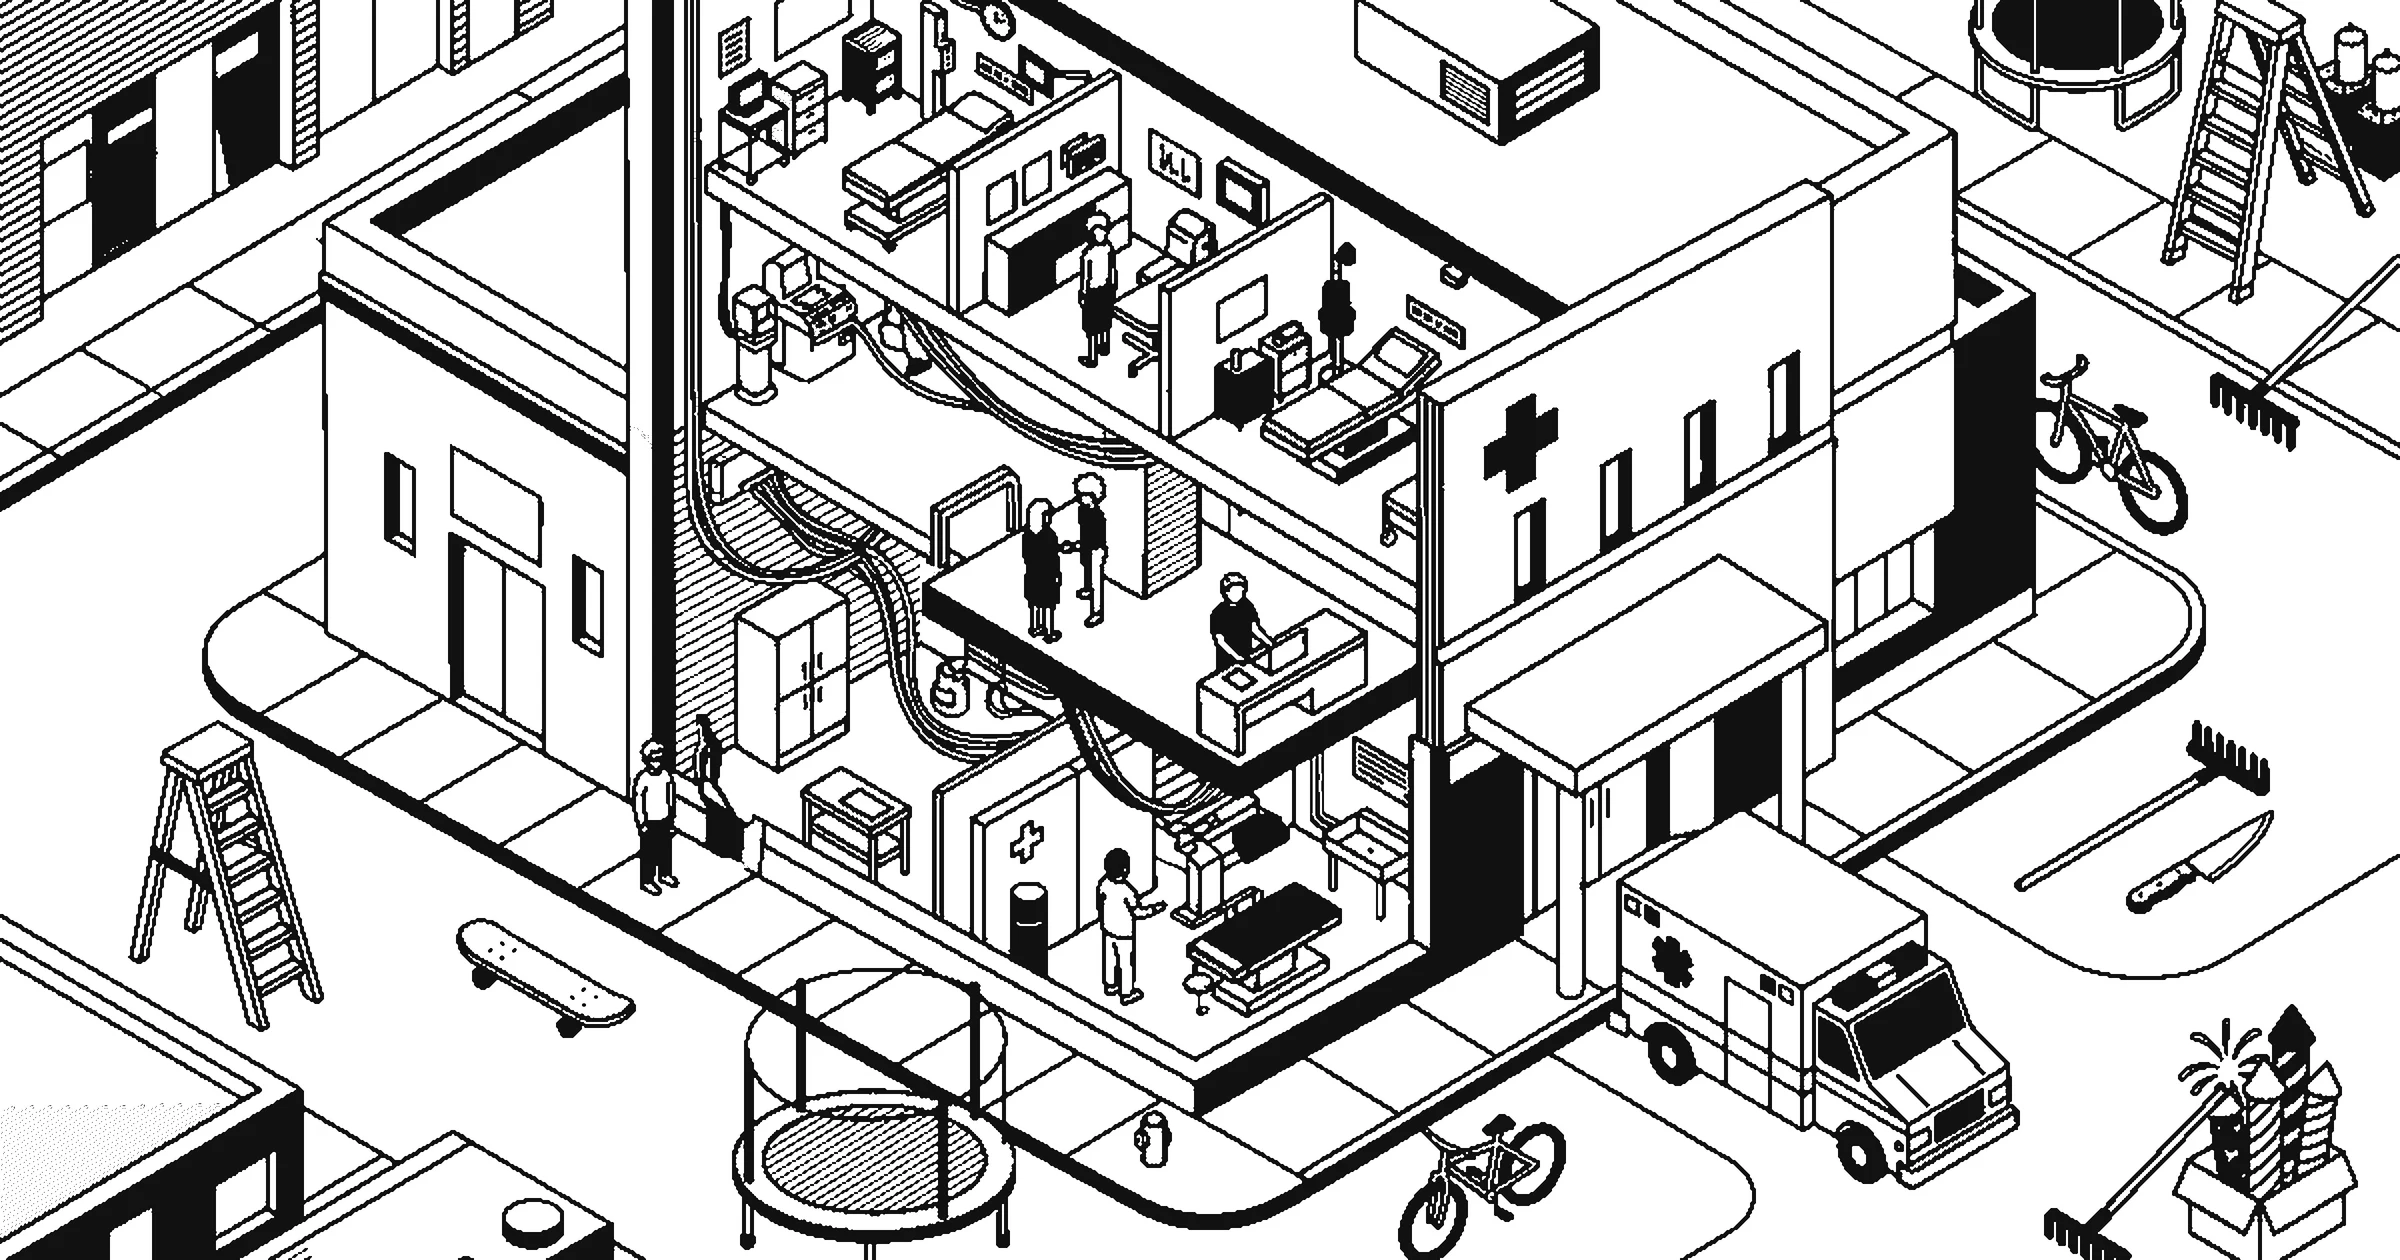 The ER, reimagined · illustration
About 45,000 a day, every day.
NEISS samples injury visits at 77 hospitals and weights each one to stand for the country. The busiest days were Mondays and the Fourth of July weekend. Mid-February was the quietest stretch.
injury visits to US emergency rooms involving a consumer product, sport or activity.
Each day’s figure is estimated from 794 to 1,387 sampled visits, so single days are noisy. The weekly average is the steadier signal.
2.2 million ER trips ended on the floor.
When someone falls and nothing else is to blame, hospitals code the floor. It was involved in 13% of all visits, and six in ten of those patients were 65 or older.
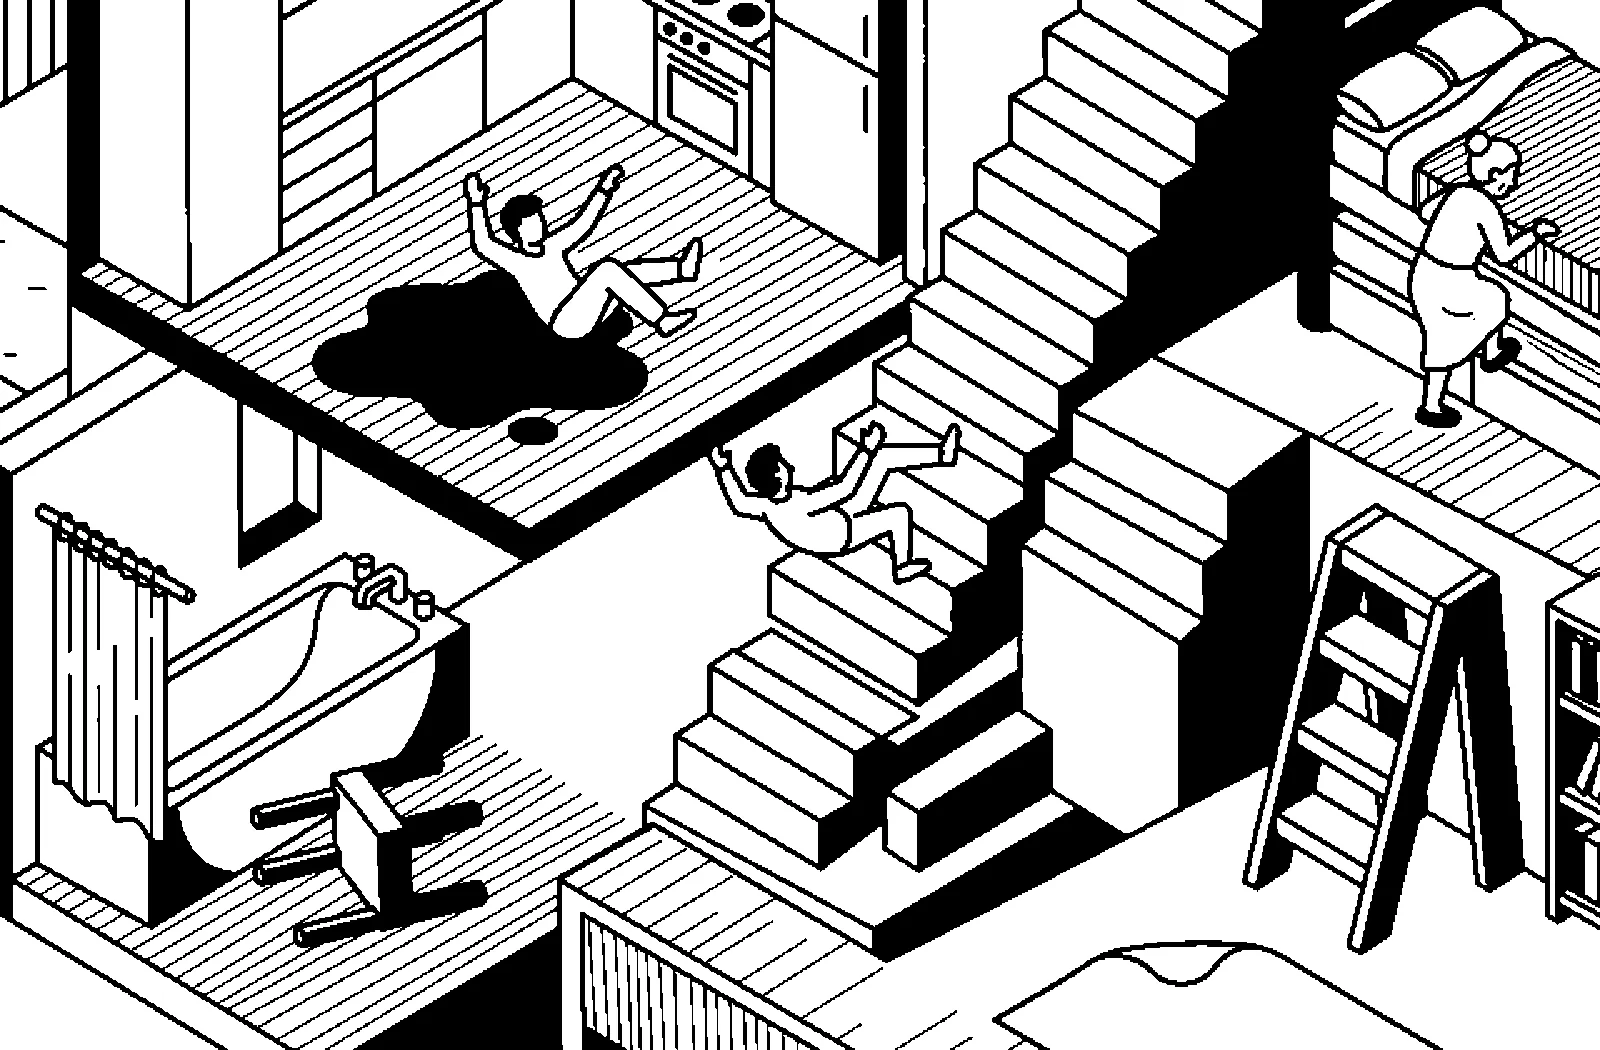
Each visit is counted under the first product the hospital coder named. A product being involved does not mean it was faulty or caused the injury. Floors are coded when someone falls and hits the ground with nothing else to blame. Many stair and bed visits are falls too.
More than half of all visits began with a fall.
Mostly Right’s Clef model read every narrative and named how the injury happened. Falls accounted for an estimated 9.2 million visits, 55.7% of the year.
Mechanisms are Clef model tags assigned from the narrative alone. About 3% of visits were tagged unknown or other and are not shown.
After 80, nine visits in ten were falls.
Children visit often but almost always go home. From young adulthood on, more injuries come from falling and more end in a hospital bed: one visit in three for people 80 and older.
Admitted means treated and admitted or hospitalised. About 3% more ended in a transfer or an observation stay.
Monday is the busiest day.
Mondays averaged 47,324 visits, 8.6% more than Thursdays. Weekends ran almost as high, then injuries tapered through the working week.
Average estimated visits per calendar day of each weekday in 2025. Some Monday visits may be weekend injuries that waited for treatment.
Every season has its own injuries.
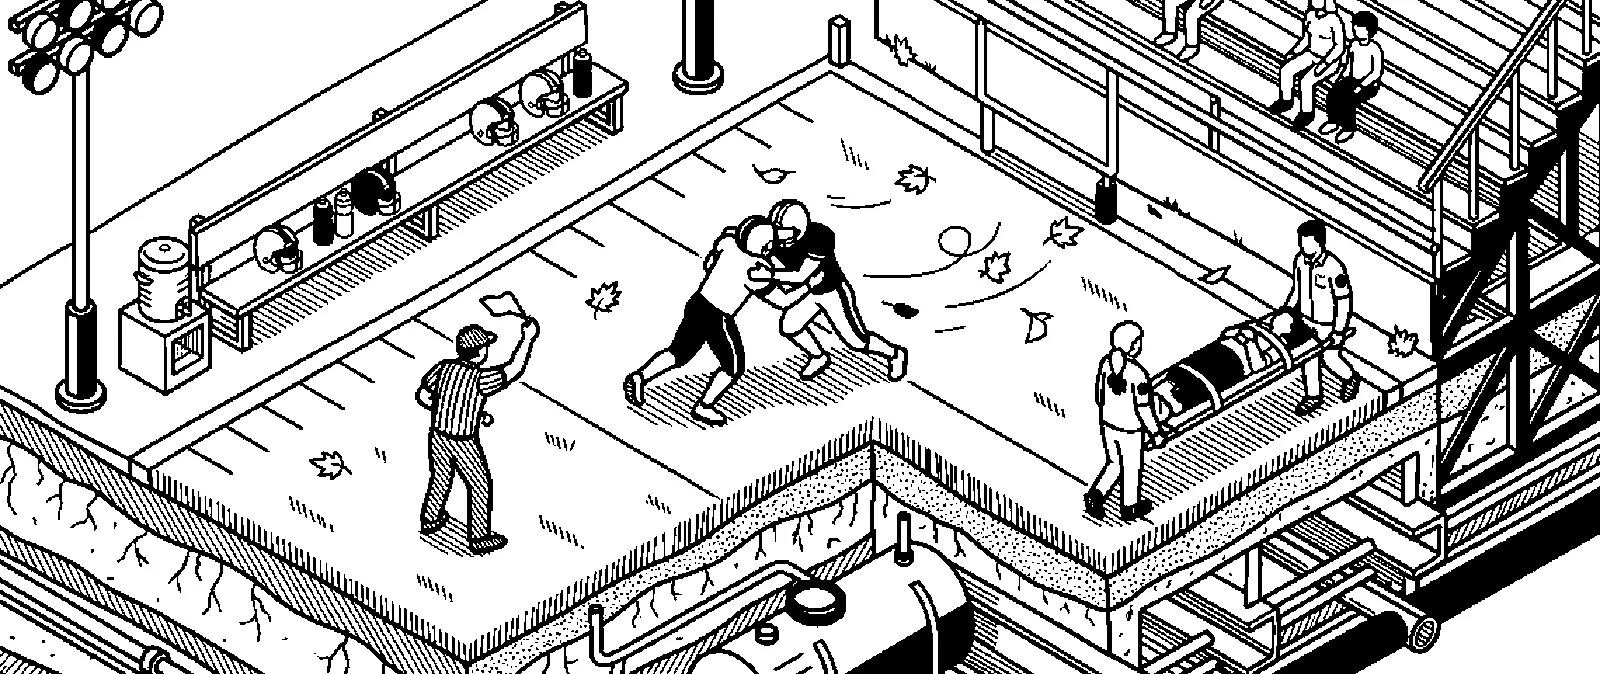
Football injuries were 13 times as common in September as in January. Swimming peaked in July and sledding in January.
Estimated visits per month, by the first product named. Each panel has its own scale. The darkest bar marks the peak month.
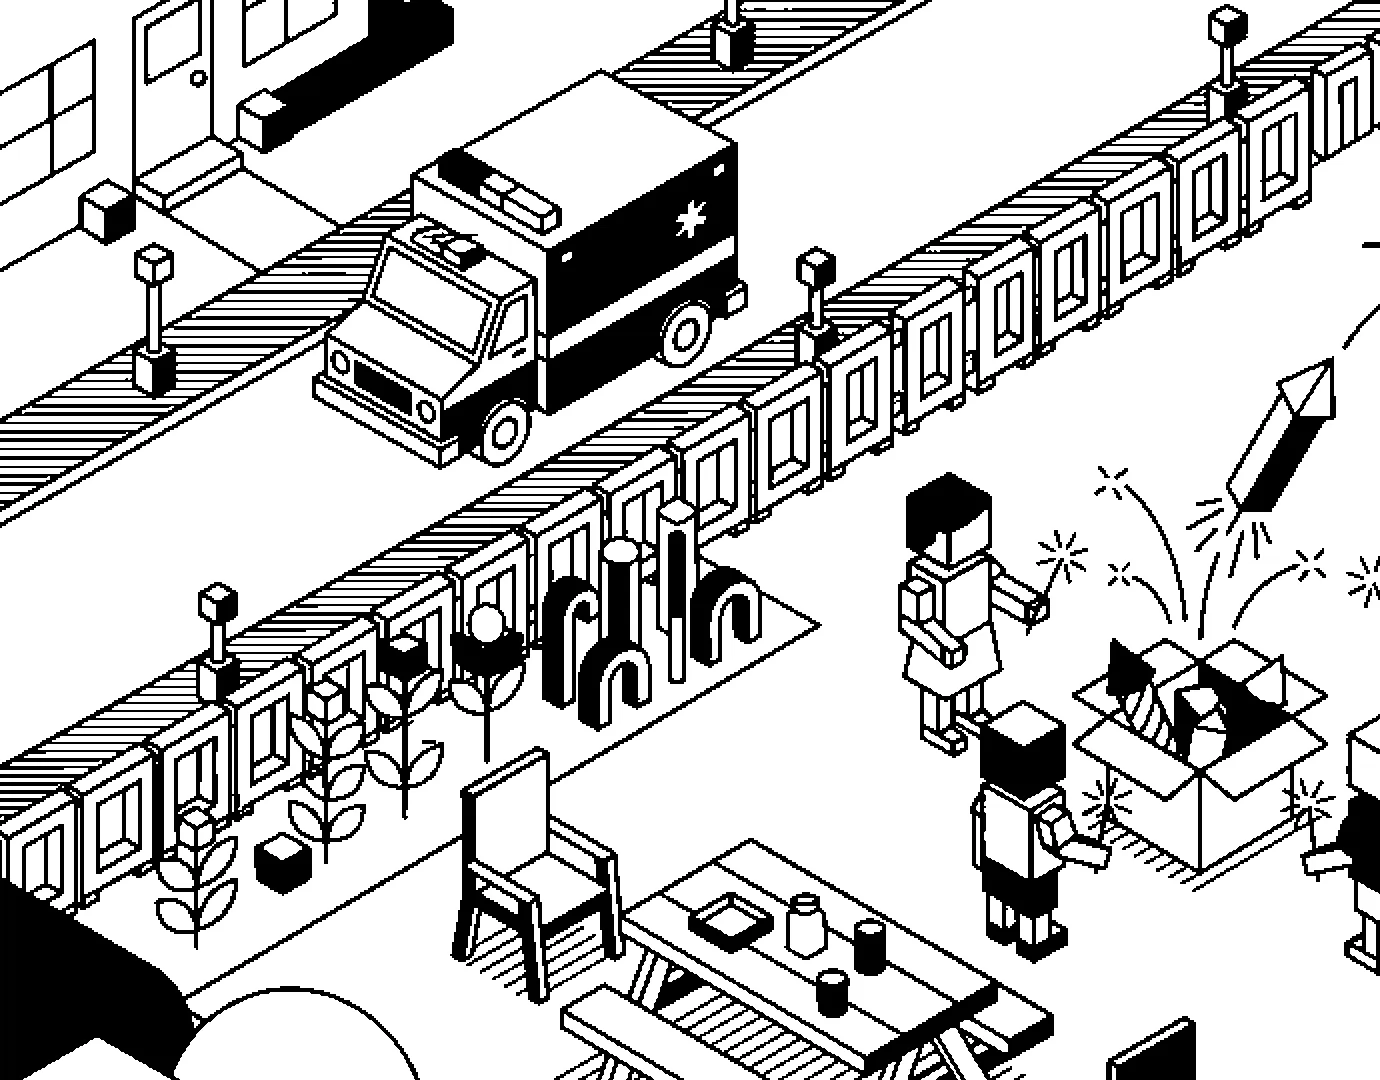
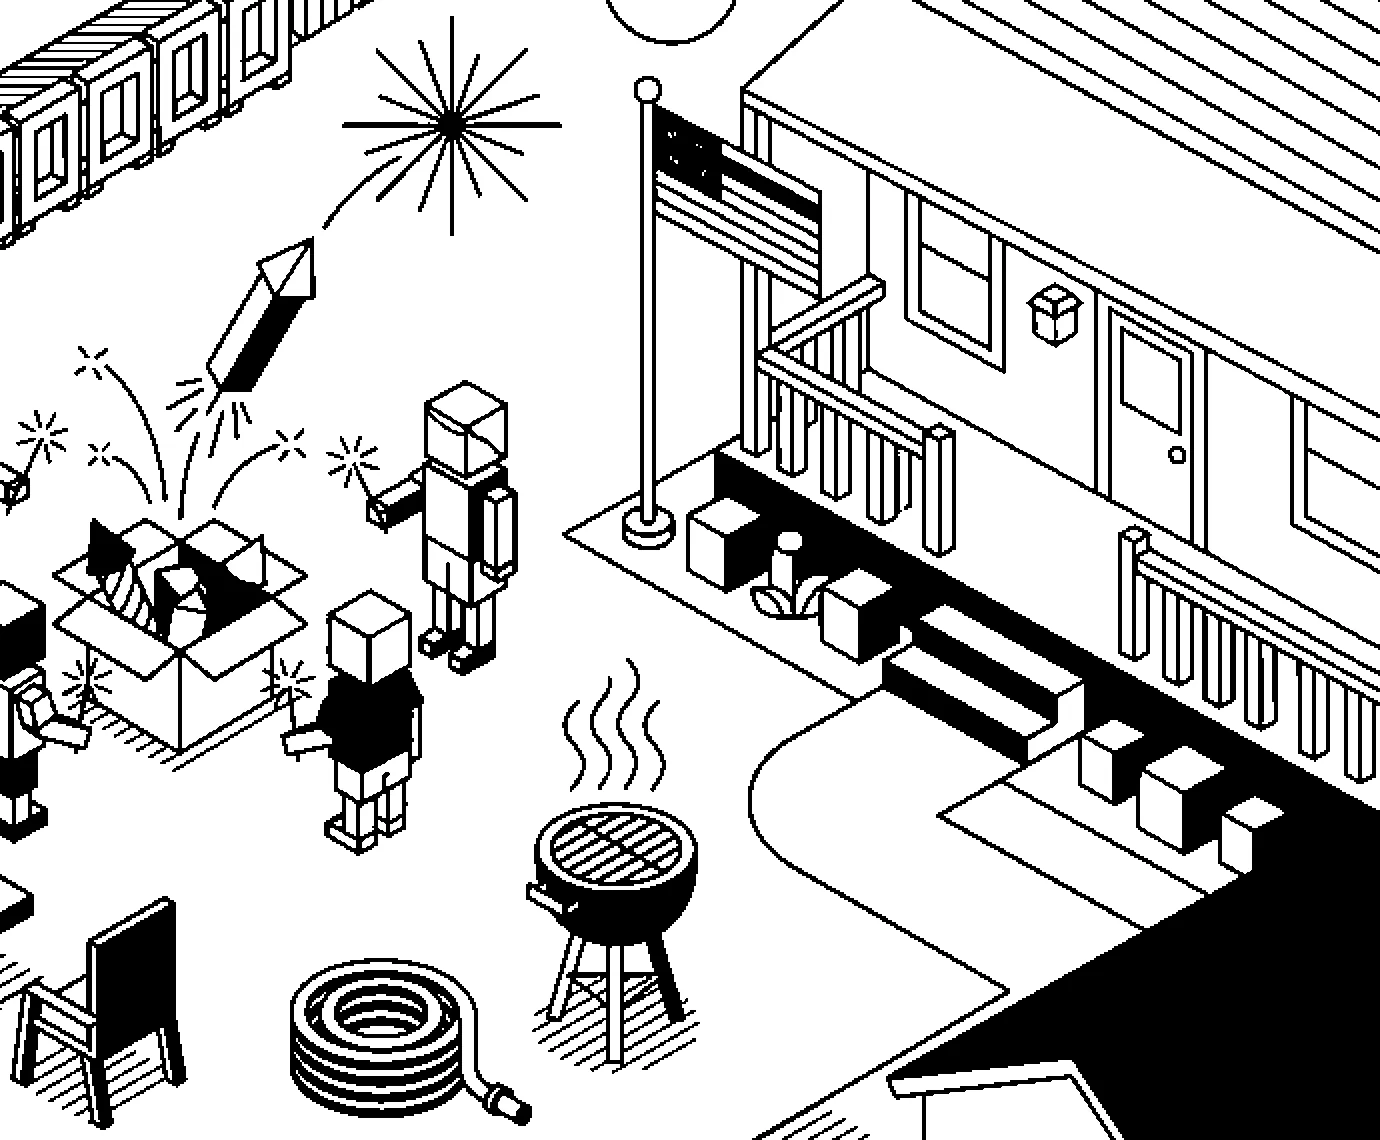
Nearly half of fireworks injuries came on two days.
An estimated 13,029 people went to the ER after fireworks in 2025. 5,951 of them came on 4 and 5 July, and 70% within a month of Independence Day.
Visits where fireworks were any of the three products named, 24 June to 14 July. The estimate rests on 333 sampled cases, so daily figures carry wide margins.
Every visit comes with a one-line story.
Coders write each visit in shorthand capitals. Clef scored every one for how unusual it is. Only 181 visits scored 0.9 or higher.
We chose these stories by hand. The highest-scoring visits also include self-harm and sexual injuries, which we left out. YOM means year-old male, YOF year-old female, DX diagnosis.
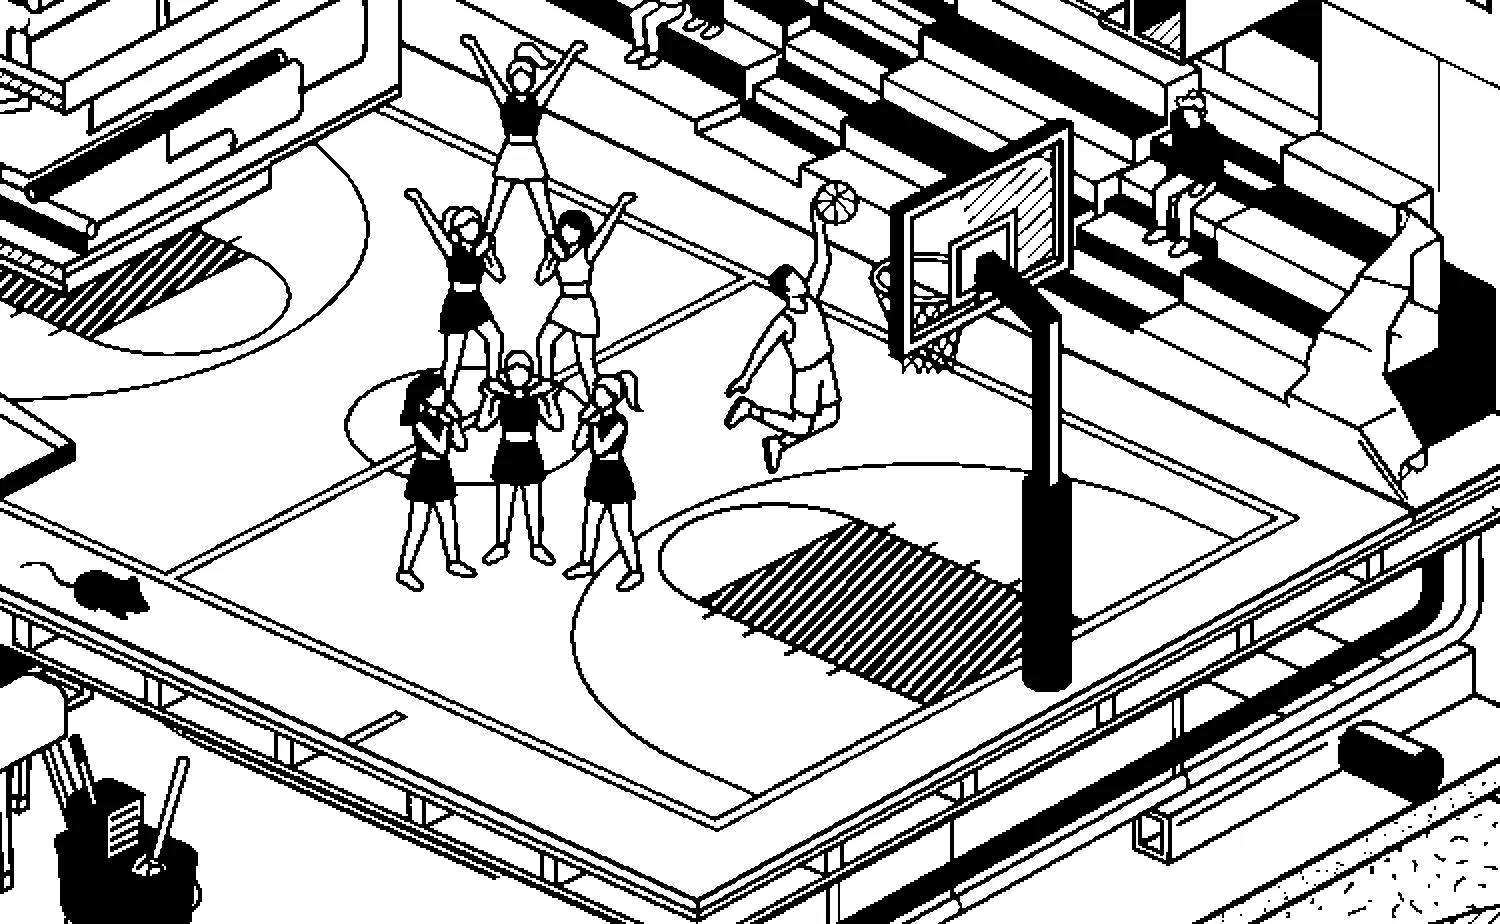
Cheerleading owns the word “stunt”.
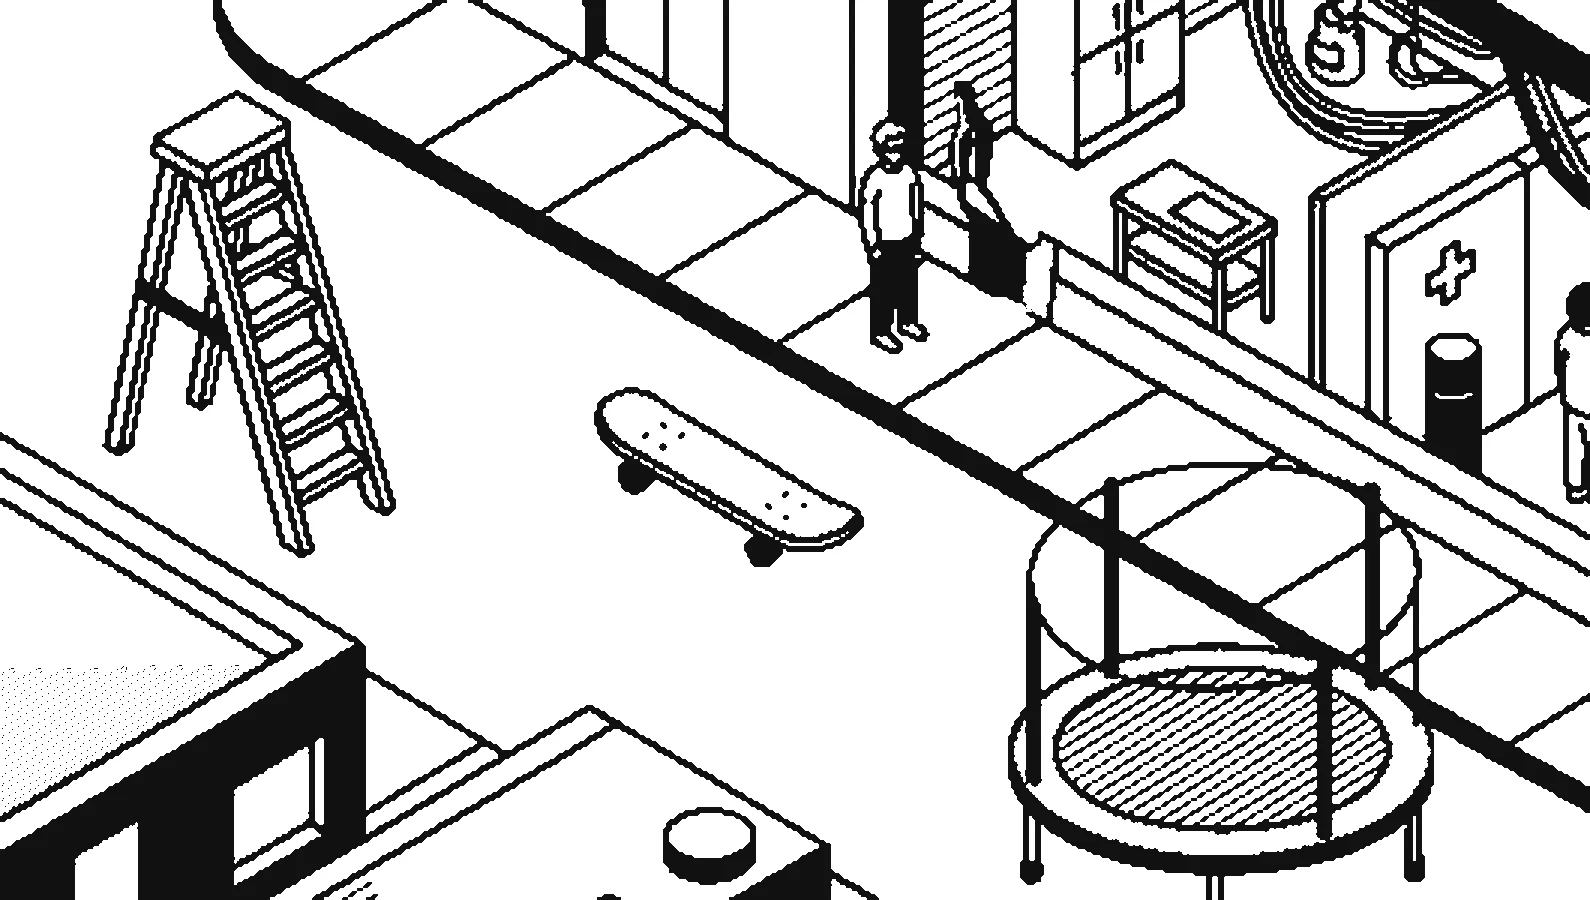
Clef flagged 236 visits as almost certainly caused by a stunt, dare or prank. 36% of them mention cheerleading. Their median age was 15.
of the visits Clef rated as stunts, dares or pranks mention cheerleading.
Stunt visits are those Clef scored 0.9 or higher. Clef scores are model output, not calibrated probabilities. Shares are of sampled cases, not weighted estimates.
Most people went home the same day.
83% were treated and released. One visit in eight ended in a hospital admission. An estimated 14,916 patients died in the ER or arrived dead.
Deaths rest on 376 sampled cases, almost half of them people 65 or older. NEISS records consumer-product injuries, so these are not all injury deaths.
In 2025, most trips to the ER began with a fall.
Fireworks, stunts and alligators make headlines. Floors, stairs and beds fill the waiting room, and they hurt older people most.
Explore the dataset ↗Sources, definitions & limitations
Counts are recomputed from the US Consumer Product Safety Commission’s National Electronic Injury Surveillance System (NEISS), treatment dates 1 January–31 December 2025, as sealed in Mostly Right’s dataset: 410,201 sampled visits from 77 hospitals. NEISS is a probability sample. National figures sum each visit’s sample weight and are estimates with sampling error, largest for small groups and single days. This preview does not imply a revised dataset build has been published.
NEISS covers injuries involving consumer products, sports and recreation, not every emergency-room visit. Products are the coder’s categories; each visit is counted under its first product unless noted. “Floor” is coded when someone falls and nothing else is to blame. Admitted means treated and admitted or hospitalised. Mechanism, emoji, weirdness and stunt fields are Clef model tags read from the narrative alone; they are not verified and their scores are not calibrated probabilities.
All figures reconcile to the sealed table; the build script and aggregates are versioned with the page. Source accuracy and coder consistency remain limitations. Narratives are quoted verbatim from CPSC and chosen by hand to exclude self-harm, sexual and drug-related cases. Ages, sexes and dates are as coded. Daily peaks may partly reflect when people sought care rather than when they were injured. The interactive timeline shows how daily visits changed.
Illustrations are conceptual, generated with Gemini using the dataset-cover art direction: seven scenes, each reduced to two tones by snapping the cover palette so that outline ink and one accent become black and the ground and lighter fill become white. The hard four-colour cover cut is not used for display. Motion uses the Transitions.dev text-reveal recipe. Fonts retain their bundled licence notices. The illustrations do not encode data.